high-speed-charting是MFC上的开源图表库,Teechart的替代品。
high-speed-charting的下载地址
https://www.codeproject.com/Articles/14075/High-speed-Charting-Control
特性
High-speed drawing (when axis is fixed) which allows fast plotting of data
Unlimited number of series (memory is the limitation)
Unlimited amount of data per series
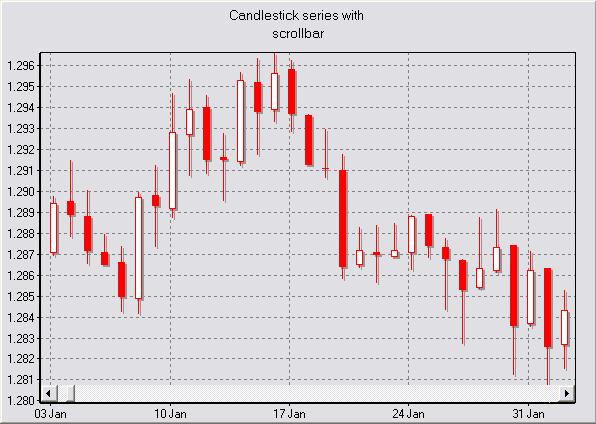
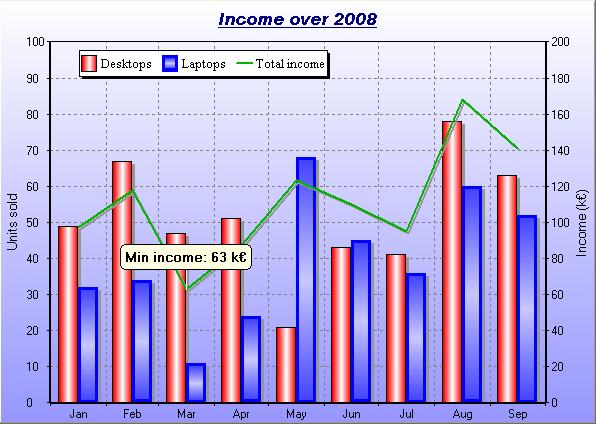
Line, point, surface, bar, candlestick and Gantt series available
Up to four axes (left, bottom, right, and top axes)
Standard, logarithmic or date/time axis
Automatic, and/or inverted axes (independent from each other)
Axis labels
Point labels
Smooth curves
Grid
Legend and titles
Interactivity (notifications when specific events occur in the control)
Support for manual zoom and mouse panning
Support for cursors
Support for scrollbar on the axes
Highly customizable (colors, titles, labels, edge, fonts, etc.)
Support for UNICODE
Support for printing and saving to an image file
图表
使用方法
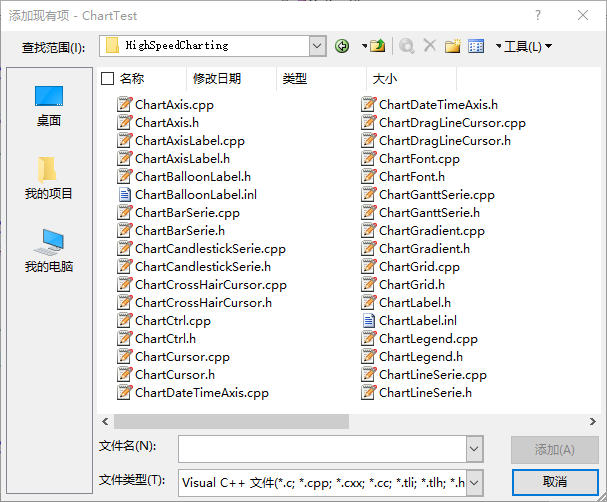
下载源码解压,放在mfc源码目录,包含在mfc项目里面,项目,添加现有项,全部添加
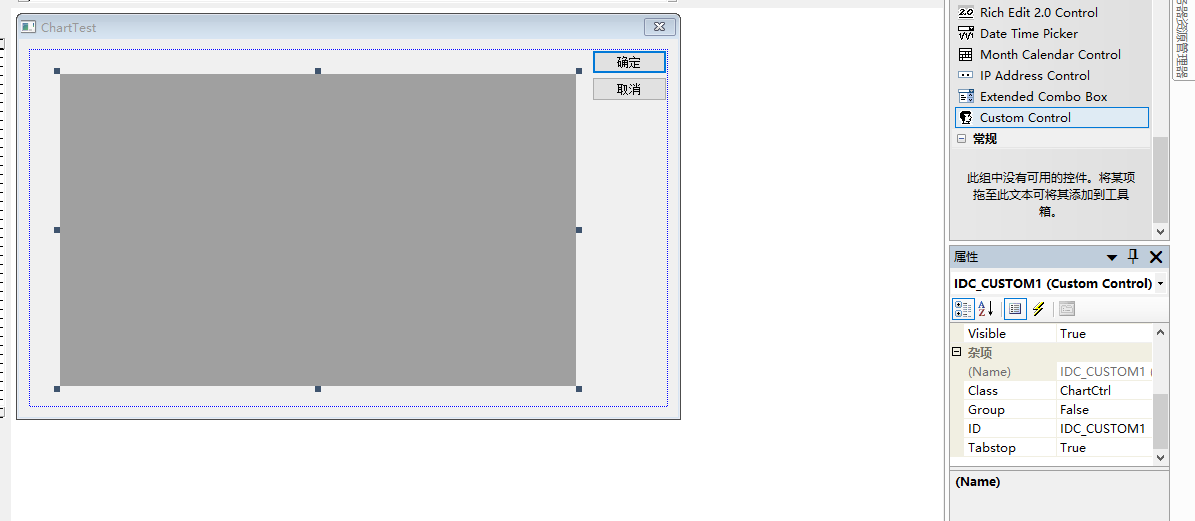
在要显示图表的窗体上添加一个自定义控件,属性,Class名字为ChartCtrl,ID默认就行
在窗体头文件中,包含头文件
#include "HighSpeedCharting/ChartCtrl.h"

#include "HighSpeedCharting/ChartAxisLabel.h"

#include "HighSpeedCharting/ChartLineSerie.h"
窗体类里定义控件变量
数据交换,参数是自定义控件ID和图表控件变量
void CChartTestDlg::DoDataExchange(CDataExchange* pDX)

{

    CDialog::DoDataExchange(pDX);

    DDX_Control(pDX, IDC_CUSTOM1, m_ChartCtrl);

}
创建两个坐标轴,一个标准坐标轴,一个时间坐标轴
    //创建坐标轴

    CChartAxis *pAxis= NULL;

    pAxis = m_ChartCtrl.CreateStandardAxis(CChartCtrl::LeftAxis);

    pAxis->SetAutomatic(true);

    CChartDateTimeAxis* pDateAxis= NULL;

    pDateAxis = m_ChartCtrl.CreateDateTimeAxis(CChartCtrl::BottomAxis);

    pDateAxis->SetAutomatic(true);

    pDateAxis->SetTickLabelFormat(false,L"%m-%d");
设置坐标轴标题
//设置标题
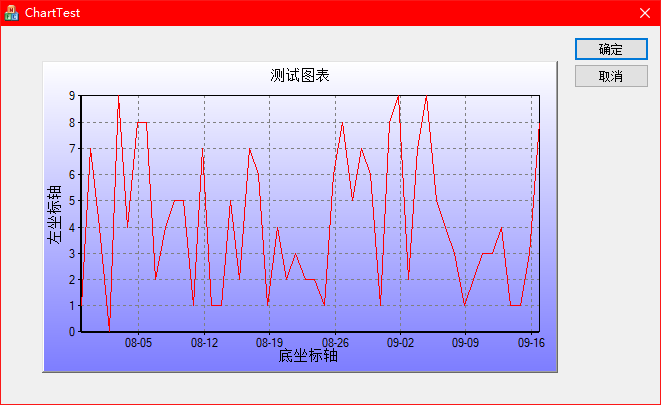
m_ChartCtrl.GetTitle()->AddString(L"测试图表");
m_ChartCtrl.GetLeftAxis()->GetLabel()->SetText(L"左坐标轴");
m_ChartCtrl.GetBottomAxis()->GetLabel()->SetText(L"底坐标轴");
外观
添加坐标点数据,日期坐标轴支持COleDateTime表示的日期,关于COleDateTime 类的介绍,参考MSDN:
https://learn.microsoft.com/zh-cn/cpp/atl-mfc-shared/reference/coledatetime-class?view=msvc-170
    //添加数据点

    COleDateTime cdt(COleDateTime::GetCurrentTime());

    COleDateTimeSpan tsp(1,0,0,0);

    for (int i=0; i<50; i++)

    {

        x[i] = cdt.m_dt;

        y[i] = rand()%10;//添加随机数据

        cdt += tsp;

    }
创建线
    //创建线系

    m_ChartCtrl.EnableRefresh(false);

    CChartLineSerie *pLineSerie = m_ChartCtrl.CreateLineSerie();

    pLineSerie->SetSeriesOrdering(poNoOrdering);//设置为无序

    pLineSerie->AddPoints(x, y,50);

    pLineSerie->SetName(L"line0");

    m_ChartCtrl.EnableRefresh(true);
运行
动态图表
动态图表无非是实时的重绘数据,更新数据
利用MFC的定时器实现动态图表
启动定时器
在OnTimer中绘制图表
void CChartTestDlg::OnTimer(UINT_PTR nIDEvent)

{

    // TODO: 在此添加消息处理程序代码和/或调用默认值


    CDialog::OnTimer(nIDEvent);


    //时间步长

    COleDateTimeSpan tsp(1,0,0,0);

    //更新点

    for(int i=0;i<49;i++)

    {

        x[i] = x[i+1];

        y[i] = y[i+1];

    }

    y[49] = rand()%10;

    x[49] = x[48]+tsp.m_span;


    //绘制线

    m_ChartCtrl.EnableRefresh(false);

    m_ChartCtrl.RemoveAllSeries();//先清空

    CChartLineSerie *pLineSerie = m_ChartCtrl.CreateLineSerie();

    pLineSerie->SetSeriesOrdering(poNoOrdering);//设置为无序

    pLineSerie->AddPoints(x, y,50);

    pLineSerie->SetName(L"line0");


    m_ChartCtrl.EnableRefresh(true);


}
效果